26-Fiscal Policy and Budget Deficits

*Fiscal policy=Gov’t tax and spending

*As opposed to previous lectures this will focus on tools instead of goals

  1. Fiscal policy is important because of the sheer size of government spending, being 1/5 of all US spending and 1/16 of world spending. Although it is huge and changes every year there are some long-term patterns
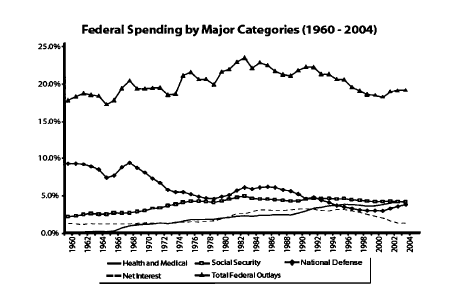
    1. Of Gov’t spending in 2005: 22% was health(mainly Medicare and Medicaid), 21% social security, 19% defense, 7% interest. These compile the bulk of Gov’t spending and these five areas comprise about 70% of the budget. 31% all the rest(agriculture, anti-poverty, international spending, communication, etc)
    2. Elderly spending, mainly Medicare Medicaid and social security, comprises roughly half of all Gov’t spending and over the decades has grown
    3. Defense spending is about 4% of GDP and has steadily gone down over time from roughly 10% in the 50’s to about 3-4% as of 2005
    4. Most arguments about Gov’t spending is over rather small, comparatively, amounts(e.g. earmarks)

  2. Federal taxes are very complex but again patterns have held over time
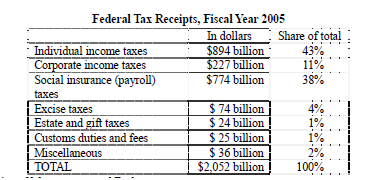
    1. 95% of federal taxes are comprised of income taxes, corporate income taxes, payroll taxes(social security taxes and Medicare, and excise taxes of gasoline, cigarettes and alcohol.
      1. In 2005 the Gov’t collected $2.05T in revenues: 43% individual income taxes, 38% social security taxes, 11% corporate income taxes, 4% excise, 2% misc., 1% customs duties and fees and 1%estate taxes

      1. Though most people tend to think of income taxes as the main tax, as shown above, payroll taxes are almost equal with most of the income taxes paid by the wealthy and most payroll taxes funded by everyone else
      2. Most people pay more in payroll taxes than income taxes
    2. Federal taxes collected have remained between roughly 17-19% of GDP since 1960, but in the mid to late 90’s crept higher up to 20.1% of GDP, the highest since WWII,
      1. Which is why Bush and Gore both campaigned in 2000 to lower taxes
      2. And by 2003 taxes collected fell sharply to 16.4% which was the lowest since the 1950’s
      3. Providing a huge swing from just a few year s before, resulting, mostly, from the “Bush tax cuts” which lowered income taxes.
  3. Usually people want to leave social security out of fiscal discussions since “it has its own trust”
    1. Amounting to arguing that since the money is in my left pocket instead of my right that it does not count
    2. But it involves a contribution under law, which is a tax and involves payouts from the government which is spending
  4. State and local budgets are left out of the discussion, though they are quite massive themselves being approximately 14% of GDP, because states require balanced budgets
    1. State and local spending focuses on, among other things; education, infrastructure and criminal justice. Education, the main recipient of s/l spending saw $600B in funds collectively, more than any one area of the federal budget
    2. The areas which s/l governments control are areas which need to be customized to its local citizenry so a person may choose the type of place he lives in. ranging from a high tax high service area, to a low tax low service area
    3. National politicians often speak of state and local issues as if they have any control over them. If one wants to fix infrastructure or reform k-12 education then he should run for governor
  5. As for the federal Gov’t, in any one year spending and taxes do not need to match. Somehow, however, the Gov’t must raise money, this is done through selling bonds(issuing a note with a promise to pay, with interest, at a later date)
    1. If a Gov’t spends more than it takes then it is a deficit, if it takes more than it spends then it is a surplus
    2. Over the past half century the US has mostly run budget deficits but towards the end of the 90’s and barely into the centuries turn we ran surpluses. This can be explained more from a tax collected standpoint as mentioned above than from a change in spending
  6. Fiscal policy of taxing and spending goes back to the four pillars of macro-economics
    1. Growth-Government borrowing and spending is part of the national identity and when a Gov’t does borrow it becomes the elephant in the bathroom soaking up available capital
      1. Which means less money for private investment
      2. Plus we become more dependent on foreign capital
      3. If there is more saving and less borrowing we can spend money on the things that have a long-term benefit
    2. Unemployment-redesigning tax burdens on employers or spending subsidies for the unemployed might reduce the natural rate of unemployment. In a recession, spending more or taxing less could stimulate aggregate demand and reduce cyclical unemployment
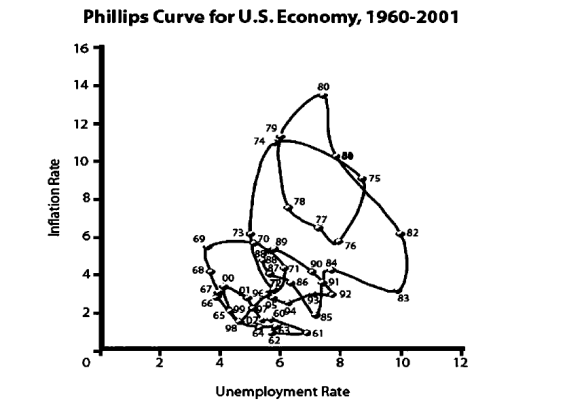
    3. Inflation-could be fought by spending cuts or tax increases
    4. Balance of trade- Gov’t borrowing increases equals more foreign funds (i.e. a higher trade deficit)

14-Public Goods

    1. About
      1. Two things define it
        1. Non-rivalrous, meaning it is not diminished by how
          many people use it
        2. Non-excludable, meaning if
          someone cannot pay or does not want to pay they will still benefit from
          it
      1. Examples are National defense, roads and bridges and
        education.
      2. Free-rider problem emerges,
        meaning, many people will feel someone or something else will pay for the
        good and so they don’t need to. If too many people adopt this thought,
        the good will not be produces
    2. The pursuit of self-interest
      can bring undesired results
      1. Prisoners dilemma is a great example in game theory of
        how rational self-interest can make all parties worse off
        1. Two prisoners are arrested and separated, both are
          presented with a set of circumstances
        2. If they stay silent they
          will be both better off collectively, but if both pursue their self
          interest then they will both be worse off, doing more time.

Prisoner
B

Prisoner A↓ Silent Confess
Silent A gets 2yearsB gets 2years A gets 8yearsB gets 1year
Confess A gets 1yearB gets 8years A gets 5yearsB gets 5years
      1. The free rider problem is a version of a prisoners
        dilemma
        1. If there are two players deciding to make an
          investment in a public good. Each player must decide to cooperate, which
          means to make a contribution or not
        2. If they both contribute
          they will be better off, but if only one contributes then one receives a
          greater benefit to contribution ratio. Even more, if neither contributes
          there is no good.
        3. You can think of this in
          terms of roommates splitting bills as well.
        4. As the number of people in
          the pool grows then each citizen will find it more difficult to
          contribute, thinking others will pay for it.
      1. The prisoners dilemma in different settings
        1. An arms race where no one country has an incentive to
          cut back on its own arms but all nations would benefit from abstaining
        2. Overuse of natural
          resources
        3. Oligopolistic cartel
      1. The prisoners dilemma is a great way to analyze how
        individuals act against the way they should act in a “perfect
        world”
    1. How can public goods be
      provided?
      1. Social mechanisms like personal recognition or shaming
      2. Financed through taxing

17-Imperfect information and insurance

  1. In a standard market you couple a willing buyer with a willing seller, but at times information is imperfect.
    1. For example, you see a car that is selling for 1/3 the market price.
      1. Ones first instinct would be to buy the cheapest, but;
      2. On a second thought “is there something wrong with it?”
    2. An employer is trying to hire an employee and it has come down to two applicants with one willing to work at half the price
      1. One would ask is he lazy? Or;
      2. Is he clueless
    3. Markets attempt to reduce risk with a variety of different methods
      1. Warranties, guarantees and service contracts
      2. Trademarks are intended to identify the maker to insure quality
      3. Resume’s licenses and certificates
      4. Financial capital, credit reports, collateral
      5. Reputation
    4. Gov’t makes companies list ingredients on packages, and make sure claims in ads are true
  2. Insurance markets rely heavily on information
    1. Insurance markets spread risk over a group
      1. An event related to the type of insurance is spread over a group
        1. The type of risk is known
        2. Exactly who it will be is not
      2. Everyone must pay into a common pool
        1. Most payouts will be concentrated to a small(relatively) percentage of the group with larger claims
        2. What the average person pays in must at least be equal to what the average person gets out
    2. What if the chance of bad events weren’t random but based on habits
      1. Moral hazard-people who have insurance have less incentive to avoid problems0
      2. Adverse selection-those who are more likely to have a bad event are more likely to have insurance
    3. Addressing moral hazard and adverse selection:
      1. Co-payments and deductibles
      2. Increase the pool to increase more people and create a more diverse demographic

25-The Unemployment/Inflation Tradeoff

  1. Economist A. W. Phillips graphed British annual unemployment data contrasted against inflation data over a 60 year period and realized a certain relationship where unemployment and inflation were interrelated and could be depicted graphically and was named the Phillips Curve.
    1. With unemployment on the horizontal axis and inflation on the vertical axis, the top left portion of the graph would represent high inflation and low unemployment, whereas the bottom right would represent low inflation and high unemployment
    2. Why is there a tradeoff?
      1. If aggregate demand and aggregate supply meet at potential GDP and then aggregate demand then further increases, Unemployment would remain low but inflation would be high as too few dollars would be chasing too many goods
      2. Conversely, if it were at potential GDP and aggregate demand is lower, then unemployment is much more of a risk with not much chance of inflation.
  2. In the U.S. this curve worked well when first used for data from the 1950’s and 60’s, however subsequent decades would challenge the curves validity
    1. In 1968 both Milton Friedman and Edmund Phelps researched and concluded that the curve would not hold up in the long run arguing that the economy would eventually revert to the natural rate of unemployment and inflation would work independently.
    2. In the 70’s both inflation and unemployment were high, in the 80’s they were low and in the 90’s both were very low


      Screen clipping taken: 6/24/2011, 2:57 PM


    3. Which made most economists conclude that the Phillips curve is more of a short term phenomena
    4. In the chart below it shows that across decades operating at about the same unemployment level inflation would work independently


      Screen clipping taken: 6/24/2011, 2:55 PM


    5. As seen above the “Phillips Curve” would be nothing more than a straight vertical line, representing no tradeoff
  3. Different views of the unemployment-inflation tradeoff see major differences between Keynesian and Neo-classical economists
    1. Keynesians fear the macro economy is subject to a failure to reconcile aggregate demand and supply
      1. Keynesians fear that the economy is inherently unstable as investments and consumption move sharply but because of sticky wages and prices, both the labor and product markets may not adjust to equilibrium quickly
      2. Keynesians also believe that if markets are to be left alone in response to disturbances we would be stuck below potential GDP with high unemployment for a long time
      3. And to actively control the markets they advocate active Governments
    2. Neo-classics believe that over time markets do adjust toward potential GDP arguing that once prices get low enough, that would in turn stimulate demand
      1. Neo-classics believe that if government interferes they have just as much chance of doing harm than of doing good
      2. If, however, the Gov’t does decide to interfere they should do so with clear cut rules so that markets can account for them
    3. Both Keynesians and neo-classics believe in the natural rate of unemployment and will look to redesign institutions to even lower that rate. However, Keynesians would use the Gov’t to actively stimulate the economy to accomplish its goals, whereas neo-classics would prefer deregulation
    4. Keynesians focus more on unemployment and neo-classics focus more on inflation
      1. Low inflation clearly lays a better groundwork for investing
      2. Low unemployment, Keynes would say, is a form of investing in human capital and experience
    5. Certain things they may agree upon are that
      1. Economic growth in the long run is what matters, but a country should seek to minimize the extremes of cycles and avoid either high unemployment or high inflation
      2. Differences come down mostly to political judgments about the effectiveness of Gov’t and which macroeconomic goals should be viewed as most important(e.g. unemployment, inflation, and long-term growth)
      3. Both schools use the aggregate supply and aggregate demand to argue their case

24-Aggregate (supply/Demand)

  1. Accomplishing the four goals of macroeconomics at the same time is tricky and the aggregate supply/aggregate demand model is a good way to look at this relationship
    1. Aggregate supply is the total amount of goods and services produced in an economy at a given overall price at a given time level limited by potential GDP(potential GDP is the state where all people are employed and all machines and materials are in full use
      1. It is limited by potential GDP(potential GDP is the state where all people are employed and all machines and materials are in full use
      2. Productive potential tends to grow at a rate of 2-3%
      3. ….among others, it’s as a result of new innovations
      4. However, certain conditions can influence the entire chain, such as energy costs
    2. Aggregate demand is the total amount of goods and services demanded in the economy at a given overall price level in a given time period
  2. Aggregate supply must equal aggregate demand; however, there are differing theories which account for the way they operate. They are Say’s law and Keynes’ law
    1. Say’s law says that production is the source of demand
      1. Or, supply creates its own demand, the neoclassical economist would say, because….
      2. …..every sale is income for someone(s)
      3. There are a few questions which arise, why are there recessions if you can just supply things, and why would an economy shrink
    2. Keynes’s law states that demand is the source of supply
      1. The economy will find itself at times with unemployed workers and product just lying around. They feel there just needs to be demand stimulation ….
      2. This is done by lowering taxes or providing subsidies and when the economy gets to grow “too much” then enact taxes and fees to depress the economy.
      3. Why doesn’t the Gov’t just stimulate to the countries content, there never has to be recessions
      4. There are limits to supply, however, which could bridle stimulation and could increase the rate of inflation
      5. This is the basis for Keynesian economics
    3. Due to fluctuations in consumer confidence and investing and business behavior coupled with the fact that wages/prices tend to be sticky(inelastic) aggregate demand may lag behind in the short run
      1. Companies want a relatively quick turnaround when buying and selling
        1. If not they back log projects
        2. Then strike with many jobs when the time is right
      2. In the 90’s a new information medium, the internet, emerged and with it, a flood of investments but in the 2000’s investments have slowed from the initial flurry.
    4. In the long run, however, aggregate supply determines the size of the economy with the occasional run ahead or behind of aggregate demand to create a recession or inflation.


23 Balance of trade

  1. Most misunderstood statistic and the 4th goal of macro
    1. If imports are higher then there is a trade deficit
    2. If exports are higher then there’s a surplus
  2. Accounting for trade
    1. Merchandise trade balance
      1. Old system of counting trade
      2. Accounted for goods only as countries weren’t trading services or investing too much
    2. Current account balance
      1. Goods, services, investment income(countries investing in another country)
      2. Bureau of economic analysis evaluates
    3. Unilateral Transfer is when a guest worker makes money in a foreign country and sends it home.
  3. U.S. Trade history
    1. Through the decades
      1. 1940’s-70’s about even, maybe a slight surplus
      2. 70’s-80’s same, maybe a slight deficit
      3. 80’s saw a boom in deficits
      4. Late 90’s early 2000’s saw a boom as well
      5. As of 2003 the Deficit sat at $531B
    2. Deficit is now(2004) about 4-5% of GDP
  4. Trade balance( sometimes symbolized as NX or net exports)
    1. Flows of capital
      1. Surplus flows in, deficits flow out
      2. When goods/services flow out, it becomes an investment in the debtors economy(that is, the surplus gets exchanged for the home countries currency and the other nations currency becomes an investment, hoping for the currency to become worth more)
      3. Borrowing brings in an influx of investments
      4. National savings investment identity(identity meaning it is true by definition)
        1. Domestic saving + foreign capital= Domestic investment + Gov’t borrowing
        2. Since its true by nature (savings identity) then if the government borrows more, then;
          1. Domestic savings went up
          2. Increased foreign capital, and/or;
          3. Domestic investment went down
        3. Investment in this case includes inventories, therefore, less domestic spending equals more inventory equals an increase in investments
      5. If Gov’t borrows more then there is less domestic money supplied, people save more
        1. Deficits equals more money supplied
        2. More inflow of foreign capital because of the money going to other countries
  5. U.S. trade deficits
    1. We have become the net debtor of the world
    2. Trade deficits helped build the RxR’s
      1. Deficits can be good if economy is going well
      2. Does the borrowing help the bottom line
        1. Borrowing money to make more money is ideal;
        2. Borrowing money to buy things that will never repay itself is to be avoided(buy it cash)
    3. No precedent for every other country investing in one other country
      1. Is it sustainable?
      2. How much longer will they continue
      3. What happens when the bill comes due
    4. However it is always best if a country invests from within, that way the fruits of the investment flows internally
  6. Trade deficits in macroeconomic terms
    1. Bi-lateral trade deficit means nothing in a macro-economic viewpoint
    2. Trade deficits are caused by patterns of national savings and investment
      1. U.S. in 1980’s and 2000’s ran up huge budget deficits and were accompanied by trade deficits
      2. The other two parts of the national savings and investment identity play a role
      3. Higher trade deficits are not controlled by how much one trades or by greater exposure, Japan(High surpluses) and U.S. (high deficits) have relatively low trade levels
      4. Higher income countries tend to have higher trade surpluses (except U.S.)
      5. Example: I have a huge trade deficit with Safeway is my life better or worse? Safeway doesn’t come in to Shirley’s to tip me out.
  7. Mercantilism
    1. Restrain imports encourage exports
      1. Aimed at obtaining the gold of other countries
      2. Thus creating dominance by then having all the money
    2. Believes only one party benefits in trade(the seller)
    3. Believes there is a fixed volume of trade
    4. There are those who still believe in such
    5. When you buy and live locally you forgo specialization

22- Inflation

  1. What is it?
    1. Third goal of macro
    2. Defined as an overall increase in price level(Just because the price of one good goes up does not mean inflation has taken hold)
    3. Increased buying power and not enough supply(post WWII) or;
    4. No money and high supply(depression)
  2. Basket of goods
    1. Takes necessary items in an economy and tracks their price from year to year to find inflation
      1. 1st year basket costs $100, 2nd $103 = 3%
      2. Examples in U.S.
        1. Consumer price index(CPI)
        2. Producer price index
        3. Wholesaler price index
        4. GDP deflator(Not really a basket of goods) Nominal GDP/Real GDP*100=GDP deflator
          1. Not really a basket of goods
          2. Specifically takes into account each good produced domestically weighted against the market value of consumed goods
          3. This is the only approach that implicitly takes substitution effect into account
    2. Concerns
      1. May overstate inflation
        1. Boskin commission found inflation is overstated by 1%/yr
        2. Headed by Michael Boskin who was on a congressional advisory committee on CPI
        3. Criticized for understating inflation
      2. People don’t buy same goods(why buy vhs when there are DVDs)
      3. Substitution effect
    3. Negate concerns
      1. Rotate goods in basket
      2. Check the basket regularly to see if it shows an accurate picture
  3. Nature of inflation
    1. Inflation is not necessarily bad
      1. If everything goes up at the same time to the knowledge of everyone involved there is no change
      2. Not everything goes up at same time(if financing at a fixed rate the higher the inflation the better)
    2. High inflation
      1. No one know what the price of anything is
        1. Stores in hyper inflated towns had many price labels on top of each other due to rapidly adjusting prices;
        2. Used just a bar code which led to more ambiguity
        3. Too much money chasing too little goods
        4. No one can plan


    3. Policies to rectify
      1. Cut Gov’t spending
      2. Make interest rates rise
      3. Increase taxes
  4. 2 philosophies on inflation
    1. Hawks
      1. “economy works best around 0%”
      2. Able to better plan long-term
    2. Doves
      1. “small amount of inflation is ok
      2. Can make Implicit contract wages more volatile(e.g. if inflation goes up 4% give a 2% wage increase and your coming out above inflation


21-(UE) Unemployment

  1. 1st goal of Macro is growth, the second is to reduce unemployment
  2. Who’s unemployed?
    1. 1/3 out of labor force( unemployable)
    2. Bureau of labor statistics formula(No work+looking for work=unemployed)
      1. Housewife is employed but she is not looking
      2. Someone working part-time but is looking for fulltime work is employed
      3. Discouraged worker is one who has stopped looking because it’s become a waste of time(under this model he is not counted as UE)
    3. Economics see UE as a market
      1. Qualified+ Ready to work+ no employment= UE
      2. Low?- Wages are above equilibrium
    4. Why wages are above equilibrium
      1. Min. wage laws
      2. Strong unions playing hardball( unions would rather lose members, than decrease wages)
      3. Implicit contract
        1. Scheduled pay increases
        2. Benefits
        3. All are not guaranteed, but implicitly so
      4. Fear of loss of morale
        1. If implicit contract, it’s tough to go to employees and renege on a promise
        2. Union strikes and grievances
  3. The cost of unemployment
    1. Social pathology
      1. Increased crime
      2. Dysfunction in home
      3. Increased anxiety
    2. Reduces size of economy
      1. Lost output
      2. Consumption of welfare resources
  4. Types of unemployment
    1. Natural rate
      1. Natural rate variables
        1. Laws and regulations( the more regulations, the less hiring and more firing is being done)
        2. Entering workforce/retiring
        3. There will never be 0% unemployment
      2. Reduce natural rate
        1. Adjust unemployment benefits so they are higher at the beginning and taper from there
        2. Expand Gov’t programs concerning: worker training, college scholarships, etc
        3. Dreg
    2. Cyclical
      1. Bears and bulls
      2. Less product demand = less labor demand( and vice versa)
      3. Solutions
        1. Fiscal- tax cuts
        2. Monetary- decrease interest rates
  5. U.S. vs. EUR.
    1. U.S.
      1. Fluctuates below 10%, usually around 5-7%
      2. Cares more about unemployment than inflation
    2. EUR
      1. Hovers around 10%
      2. More Gov’t interaction
        1. Higher min wage
        2. Longer vacation time
        3. Regulation of when places of biz can conduct work
        4. Better benefits for employees
      3. U.K. has reformed by deregulating
        1. Lower UE( around U.S. numbers)
        2. Still has a higher number of benefits and wage controls
  6. Wages increase with GDP growth
    1. Get more productive
      1. Education
      2. Technology
    2. Stimulate demand
    3. Redistribution does nothing


20-Economic Growth

  1. What would you rather have $50,000 today or in 1925
    1. Increased inflation
      1. Relatively rich in 1925
      2. Middle class today
    2. Increased technologies
      1. Travel, electronics, medicine among many
      2. If not 1925, where would the class v. technology ratio pay off
  2. Economic growth compounds overtime
    1. FV=PV(1+GRt)[GR=Growth Rate]
    2. Example: Take the present value of GDP(GR)
      1. 3% normal GR 5% good 8%great(think Japan late 70’s, U.S. Post depression, China mid 2000’s
      2. GDP works like compound interest
        1. GDP ratios between Rich countries and poor ones
          1. 1870- 6:1
          2. 1960- 38:1
        2. Smaller countries mimic motions of past generations, thus no growth
        3. Catch-up growth occurs when a newly industrializing country benefits from known techs
          1. If a country falls behind it can take decades to get back up
          2. No economy is prospering to the peril of another.
        4. The sooner the better with newly industrializing countries(compound interest)
        5. Sources of growth (per/person output) productivity growth
          1. Physical capital .25
          2. Human capital .25
          3. Technology .5
        6. A higher GDP solves most problems(to lower costs, increase sales)


19-Macroeconomics and GDP

  1. Economics is split between micro and macro
    1. Macroeconomics represents a top down aggregate view of the economy
    2. Macro is not just a larger picture
      1. Deals with different issues such as inflation, unemployment and deficits
      2. Individual behavior can lead to unexpected results(e.g. one person at a ball game stands up to get a better view and then everyone else is standing up; no one has a better view but everyone acted rationally)
  2. GDP is the standard measure of the size of an economy
    1. GDP is total value of goods and services
    2. Can be measured as what’s produced or what’s demanded
      1. If its measured by what’s produced it includes: durable goods, non-durable goods, services and structures
      2. Consumption(nearly 70%)+Government(about 19%, social security however is labeled under consumption so always be wary of that)+Investments(which are a much smaller percentage but leads to the highest fluctuations due to investor sentiment)+Exports-Imports, or C+G+I+X-M=GDP
      3. The bureau of economic analysis measures the GDP and every few years they reviews their work and sometimes make very drastic changes
  3. Per capita GDP
    1. GDP ÷ Population= Per capita GDP
    2. This is useful to measure many different economies
  4. Real GDP means adjusted for inflation
    1. Involves establishing a base year at a base number: let’s say 1990 at $200million
    2. In 1995 nominal GDP raises to $300million but since there was an increase in prices due to inflation the real GDP is $250million
  5. GDP has imperfections
    1. Home production is not included(e.g. women went into the work place in the 70’s and things that weren’t bought and sold now were like meals and daycare)
    2. Leisure is not valued by the market. If everyone took an extra week of vacation but output remained the same there would be no shift in GDP
    3. Natural disasters are included in GDP by way of cleanup that ensues
    4. Transfers of ownership are not included
    5. GDP only counts the final product so, for example, rubber steel and iron would not be included individually, they would be blanketed under let’s say tires, and tires may not be included individually but filed under cars sold
  6. GDP shows upward trend overtime with occasional dips and spikes
    1. Recessions, on the whole, have gotten shorter excepting this current one
    2. Recessions are defined by the bureau of economic research and they define it as “a significant decline in [the] economic activity spread across the country, lasting more than a few months, normally visible in real GDP growth, real personal income, employment(non-farm payrolls), industrial production, and wholesale-retail sales.
  7. Macro policy is summarized with four goals and two sets of tools for accomplishment
    1. Goals: economic growth, low unemployment, low inflation and a sustainable balance of trade
    2. Tools: fiscal and monetary policy
    3. Model for describing relationship between goals and tools is the aggregate supply-demand model